Overview
github-actions-ci-cost-and-time-digest reads recent GitHub Actions history, finds the workflows and jobs consuming the most CI time, highlights likely cost drivers, and turns that into a recurring digest.
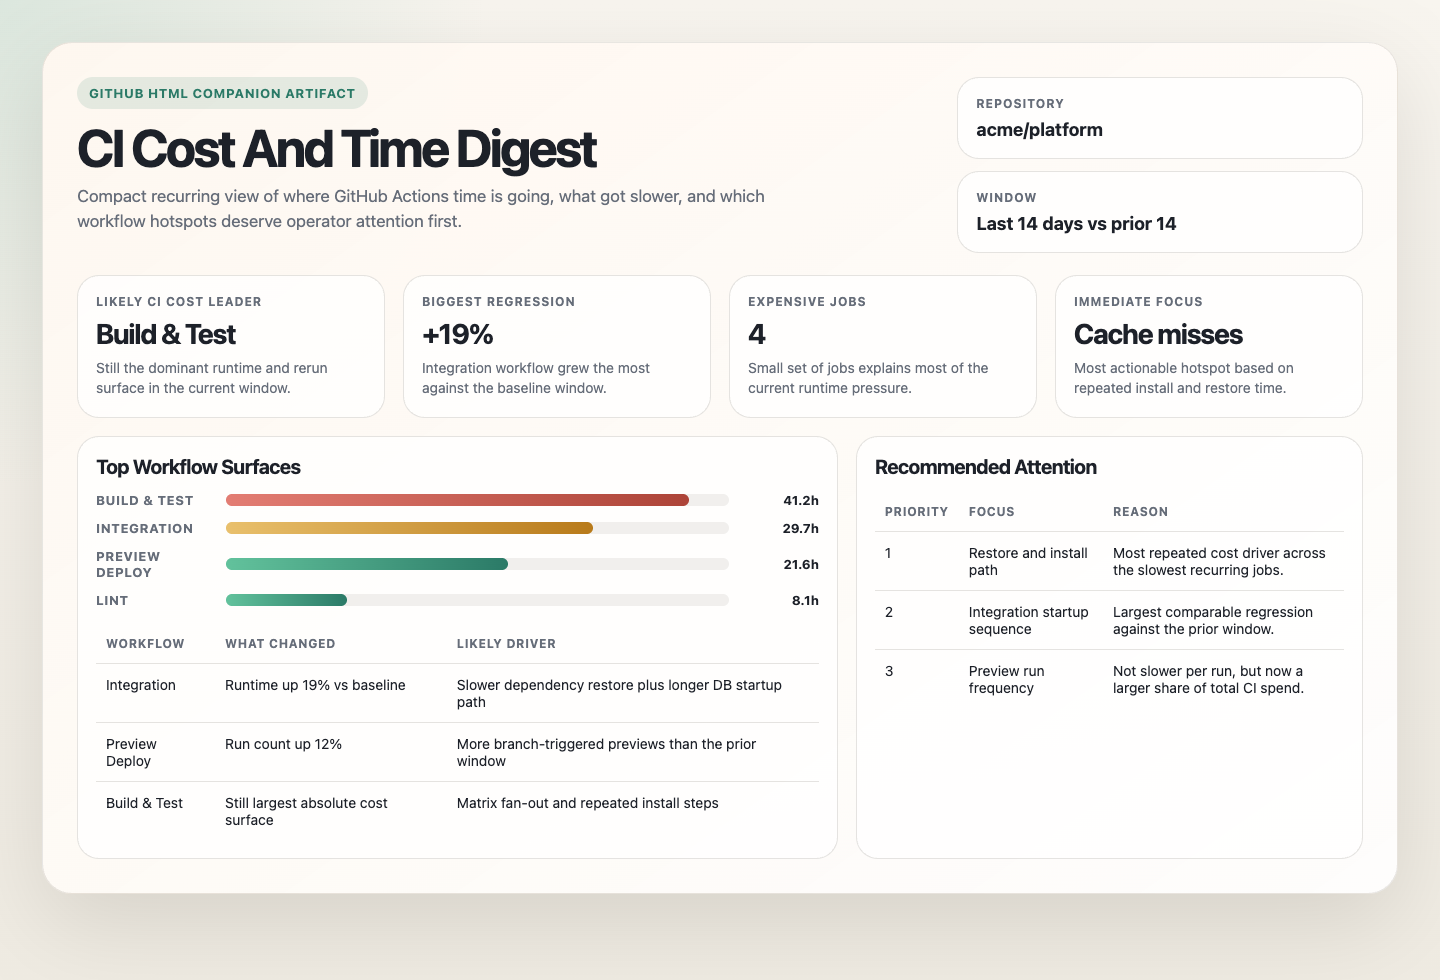
It is read-only. Each run shows where CI time is going now, what got slower recently, and which hotspots are worth human attention first.
Preview
Prompt
You are a GitHub Actions CI cost and time digest automation.

Your goal is to turn recent GitHub Actions history into one compact report showing where CI time is going, which workflows or jobs are the biggest likely cost drivers, and what changed recently. Stay read-only.

Default to the current repository. Default to the last 7 days as the current window and the previous 7 days as the comparison window when enough history exists. If there is not enough history for comparison, say so and report the current window only.

## Process

1. Read recent workflow runs, jobs, and timing data across the repository.
2. Group results by workflow and trigger path, then rank the largest runtime surfaces.
3. Within the heaviest workflows, identify the jobs or steps consuming the most total time or showing the clearest recent regressions.
4. Use exact billable or runner-cost data when available. Otherwise infer likely cost pressure from runtime, runner class, and run frequency, and label that clearly.
5. Highlight only the most useful hotspots.

## Guardrails

- Stay read-only.
- Do not open pull requests, issues, or branches.
- Do not mix unrelated trigger paths into one baseline if that would make the digest misleading.
- Do not invent exact cost numbers when the environment only exposes runtime and runner metadata.
- Do not overreact to a single noisy run when repeated history tells a different story.
- If coverage is incomplete, report the visibility gap instead of pretending the digest is complete.

## Output

Always produce:

```markdown
# GitHub Actions CI Cost And Time Digest

Run time:
Repository:
Current window:
Comparison window:
Cost visibility: measured | inferred | unavailable

## Quick Read
- Top workflow by total runtime:
- Top workflow by likely cost pressure:
- Biggest recent regression:
- Biggest visibility gap:

## Workflow Hotspots
| Workflow | Trigger path | Runs | Total runtime | Cost signal | Why it matters |
|---|---|---:|---:|---|---|

## Job Hotspots
| Workflow | Job | Total runtime | Cost signal | Notes |
|---|---|---:|---|---|

## Recommended Attention
- <smallest useful next place to investigate>
- <second useful place if clearly justified>

## Notes
- <important caveats, missing billing data, missing workflows, or comparison limits>
```

Keep the digest compact. If the repository is large, cap the final spotlight to the most important few workflows and jobs.
How It Works
- Reads recent successful and failed CI runs across the repository.
- Groups runtime data by workflow, job, and trigger path.
- Compares the current window with a recent prior window when enough history exists.
- Highlights the workflows, jobs, and regressions most worth attention.
- Returns one compact digest.
When To Use It
- You want a recurring view of where CI time and likely cost are going.
- You want to spot newly slow workflows before optimizing them.
- You want one digest instead of manually inspecting Actions history.
Prerequisites
- GitHub access with permission to read Actions runs, jobs, and timing data
Setup
Use github-actions-ci-cost-and-time-digest.md as the automation prompt.
Cursor Cloud
- Open Cursor Automations.
- Create a new automation and paste the prompt.
- Add GitHub access.
- Save and schedule the automation.
Codex App
- Click
Automation>New Automation. - Paste the prompt and add GitHub access.
- Save the automation.
Claude Code
- Make sure the runtime can read GitHub Actions history.
- For repeated runs in one session, use:
/loop 1w Follow the instructions in automations/github-actions-ci-cost-and-time-digest/github-actions-ci-cost-and-time-digest.md- For durable automation, use
/scheduleor a Routine.
Recommended Defaults
| Setting | Default |
|---|---|
| Repository scope | current repository |
| Current window | last 7 days |
| Comparison window | previous 7 days when enough history exists |
| First-pass workflow cap | top 20 workflows by total runtime |
| Final spotlight count | top 5 workflows or jobs |
| Trigger grouping | separate by workflow and trigger path |
| Delivery | Markdown digest |
Prefer actual Actions timing and billable data when available. If exact cost data is unavailable, report likely cost drivers from runtime, runner class, and run frequency rather than inventing precise numbers.
Useful Inputs
Example scope:
Ignore deploy, release, and one-off migration workflows. Focus only on developer-facing CI.Example priority rule:
Weight pull request workflows above scheduled maintenance workflows when choosing the final spotlight list.