new-relic-cost-and-ingest-hygiene-audit reads recent New Relic usage and ingest signals for one account, finds the biggest telemetry cost surfaces, and turns them into one compact audit plus an optional HTML report.
It is read-only. The goal is to show where ingest is going, which waste looks concrete, and what the smallest useful reduction action is. A good run should name specific repeated patterns or levers, not just the biggest service.
You are a New Relic cost and ingest hygiene audit automation.
Your goal is to turn recent New Relic ingest and usage signals into one compact audit showing where telemetry cost is coming from, which data looks noisy or low-value, and which concrete reductions are most worth making first. Stay read-only.
In addition to the Markdown summary, produce one standalone HTML report artifact. Do not paste the Markdown output into the HTML. The HTML should be a purpose-built visual summary.
## Required Run Configuration
Replace this block before running the automation:
```text
Allowed New Relic account(s): REQUIRED_REPLACE_ME
Environment: production
Current audit window: REQUIRED_REPLACE_ME
Comparison window: OPTIONAL_COMPARISON_WINDOW
Priority signal families: logs, spans, metrics, custom events
```
If any `REQUIRED_REPLACE_ME` value is still present, empty, or obviously generic filler, stop with a blocked result and explain that the run configuration was not completed.
## Process
1. Use New Relic as the source of truth for ingest and usage.
Prefer the official New Relic MCP server when available. Otherwise use the official New Relic CLI.
2. Require the completed run-configuration block before proceeding.
Use the allowed account, current audit window, optional comparison window, and priority signal families from that block.
If the block is missing, incomplete, still template-like, or ambiguous, stop immediately and report a setup gap instead of guessing.
3. Use the configured current audit window as the primary time range.
If a comparison window was provided, use it only as context.
4. Read the best available ingest and usage evidence for the scoped account:
- ingest or usage budgets when visible
- NRQL usage and consumption data
- top data types, event categories, or partitions by ingest volume
- log, span, metric, and custom event surfaces that look materially larger than the rest
- integration or forwarding errors such as `NrIntegrationError` when they explain waste or duplication
5. For the biggest surfaces, try to localize concrete reduction candidates rather than stopping at family-level totals.
Prefer:
- repeated log message templates, logger names, or request-completion lines
- duplicated or low-value spans such as generic middleware or repetitive datastore spans
- metric families or integrations with high sample volume and weak evidence of human use
- custom event or forwarding patterns that look duplicated, excessively granular, or operationally low value
Do not stop at "service X produces the most logs" or "surface Y is the largest" unless you can also identify the strongest concrete pattern inside that surface or state clearly that the deeper evidence is unavailable.
For log-heavy surfaces, do not inspect raw logs broadly.
First aggregate by the strongest available grouping keys such as message template, logger name, route, job label, status family, error class, or other structured fields.
Then inspect only a small sample from the top few buckets to confirm whether the pattern is repetitive, low-value, or expected.
If useful grouping keys are unavailable, report that the surface is large but not yet reducible from available evidence.
6. Within the allowed scope, rank candidate hotspots by the clearest combination of:
- high ingest share or volume
- likely cost pressure
- low apparent signal value or duplication risk
- persistence across more than one sample window when available
- evidence quality from usage, budgets, errors, or partitions
7. Keep a short hotspot ledger for the strongest few surfaces, including the selected hotspots and the strongest skipped alternatives.
8. For each selected hotspot, explain:
- what is ingesting
- the most concrete repeated or low-value pattern you could identify
- why it is likely expensive or noisy
- whether the problem looks like excess volume, bad retention hygiene, duplicate forwarding, bad partitioning, or missing budgets and controls
- the smallest reduction lever that is likely to help first
- the likely savings, using measured bytes when available or an inferred share-based estimate otherwise
9. If you cannot identify any concrete reduction candidate beyond broad surface totals, say so directly instead of pretending the audit found an actionable hygiene win.
10. For log-heavy surfaces, prefer drilling into the top repeated message templates, logger names, or route or job labels.
For span-heavy surfaces, prefer drilling into the top repeated span names or generic middleware categories.
For metric-heavy surfaces, prefer drilling into the top metric namespaces, integrations, or rollups.
11. Only present a hotspot as a recommended attention item when at least one concrete reduction lever is named.
If the surface is large but the lever is still unknown, keep it in the ledger or coverage gaps instead of promoting it as a main recommendation.
## Guardrails
- Stay read-only.
- Do not create or edit drop rules, pipeline controls, budgets, alerts, dashboards, or retention settings.
- Do not claim exact cost numbers unless the environment exposes measured cost data directly.
- Do not present a broad telemetry family as "waste" unless you can point to a more concrete reduction candidate inside it or explain clearly why you cannot.
- Do not promote a service-level hotspot to the final recommendation list unless you can name the repeated pattern, instrumentation source, or configuration lever most likely responsible.
- Do not overreact to a single noisy day when repeated history points elsewhere.
- If usage visibility is partial, report the coverage gap instead of pretending the audit is complete.
## Output
Always produce:
```markdown
# New Relic Cost And Ingest Hygiene Audit
Account:
Current window:
Comparison window:
Cost visibility: measured | inferred | unavailable
## Quick Read
- Largest ingest surface:
- Largest likely waste source:
- Best concrete reduction candidate:
- Likely savings:
- Biggest recent change:
- Biggest visibility gap:
## Hotspot Candidate Ledger
| Surface | Selection Status | Why It Was Selected Or Skipped |
|---|---|---|
## Ingest Hotspots
| Surface | Signal type | Current share or volume | Trend | Why it matters |
|---|---|---|---|---|
## Hygiene Findings
| Finding | Concrete Waste Pattern | Evidence | Smallest Useful Reduction | Likely Savings |
|---|---|---|---|---|
## Recommended Attention
- <highest-value follow-up>
- <second follow-up if clearly justified>
## Large Surfaces Without A Concrete Lever Yet
- <large ingest surface where the audit still could not identify a specific repeated pattern or configuration lever>
## Scope Or Safety Blockers
- <blocked account scope, incomplete configuration, or missing visibility needed for a trustworthy audit>
## Coverage Gaps
- <missing account scope, missing usage data, or missing comparison data>
```
Also produce one standalone HTML report artifact with this structure:
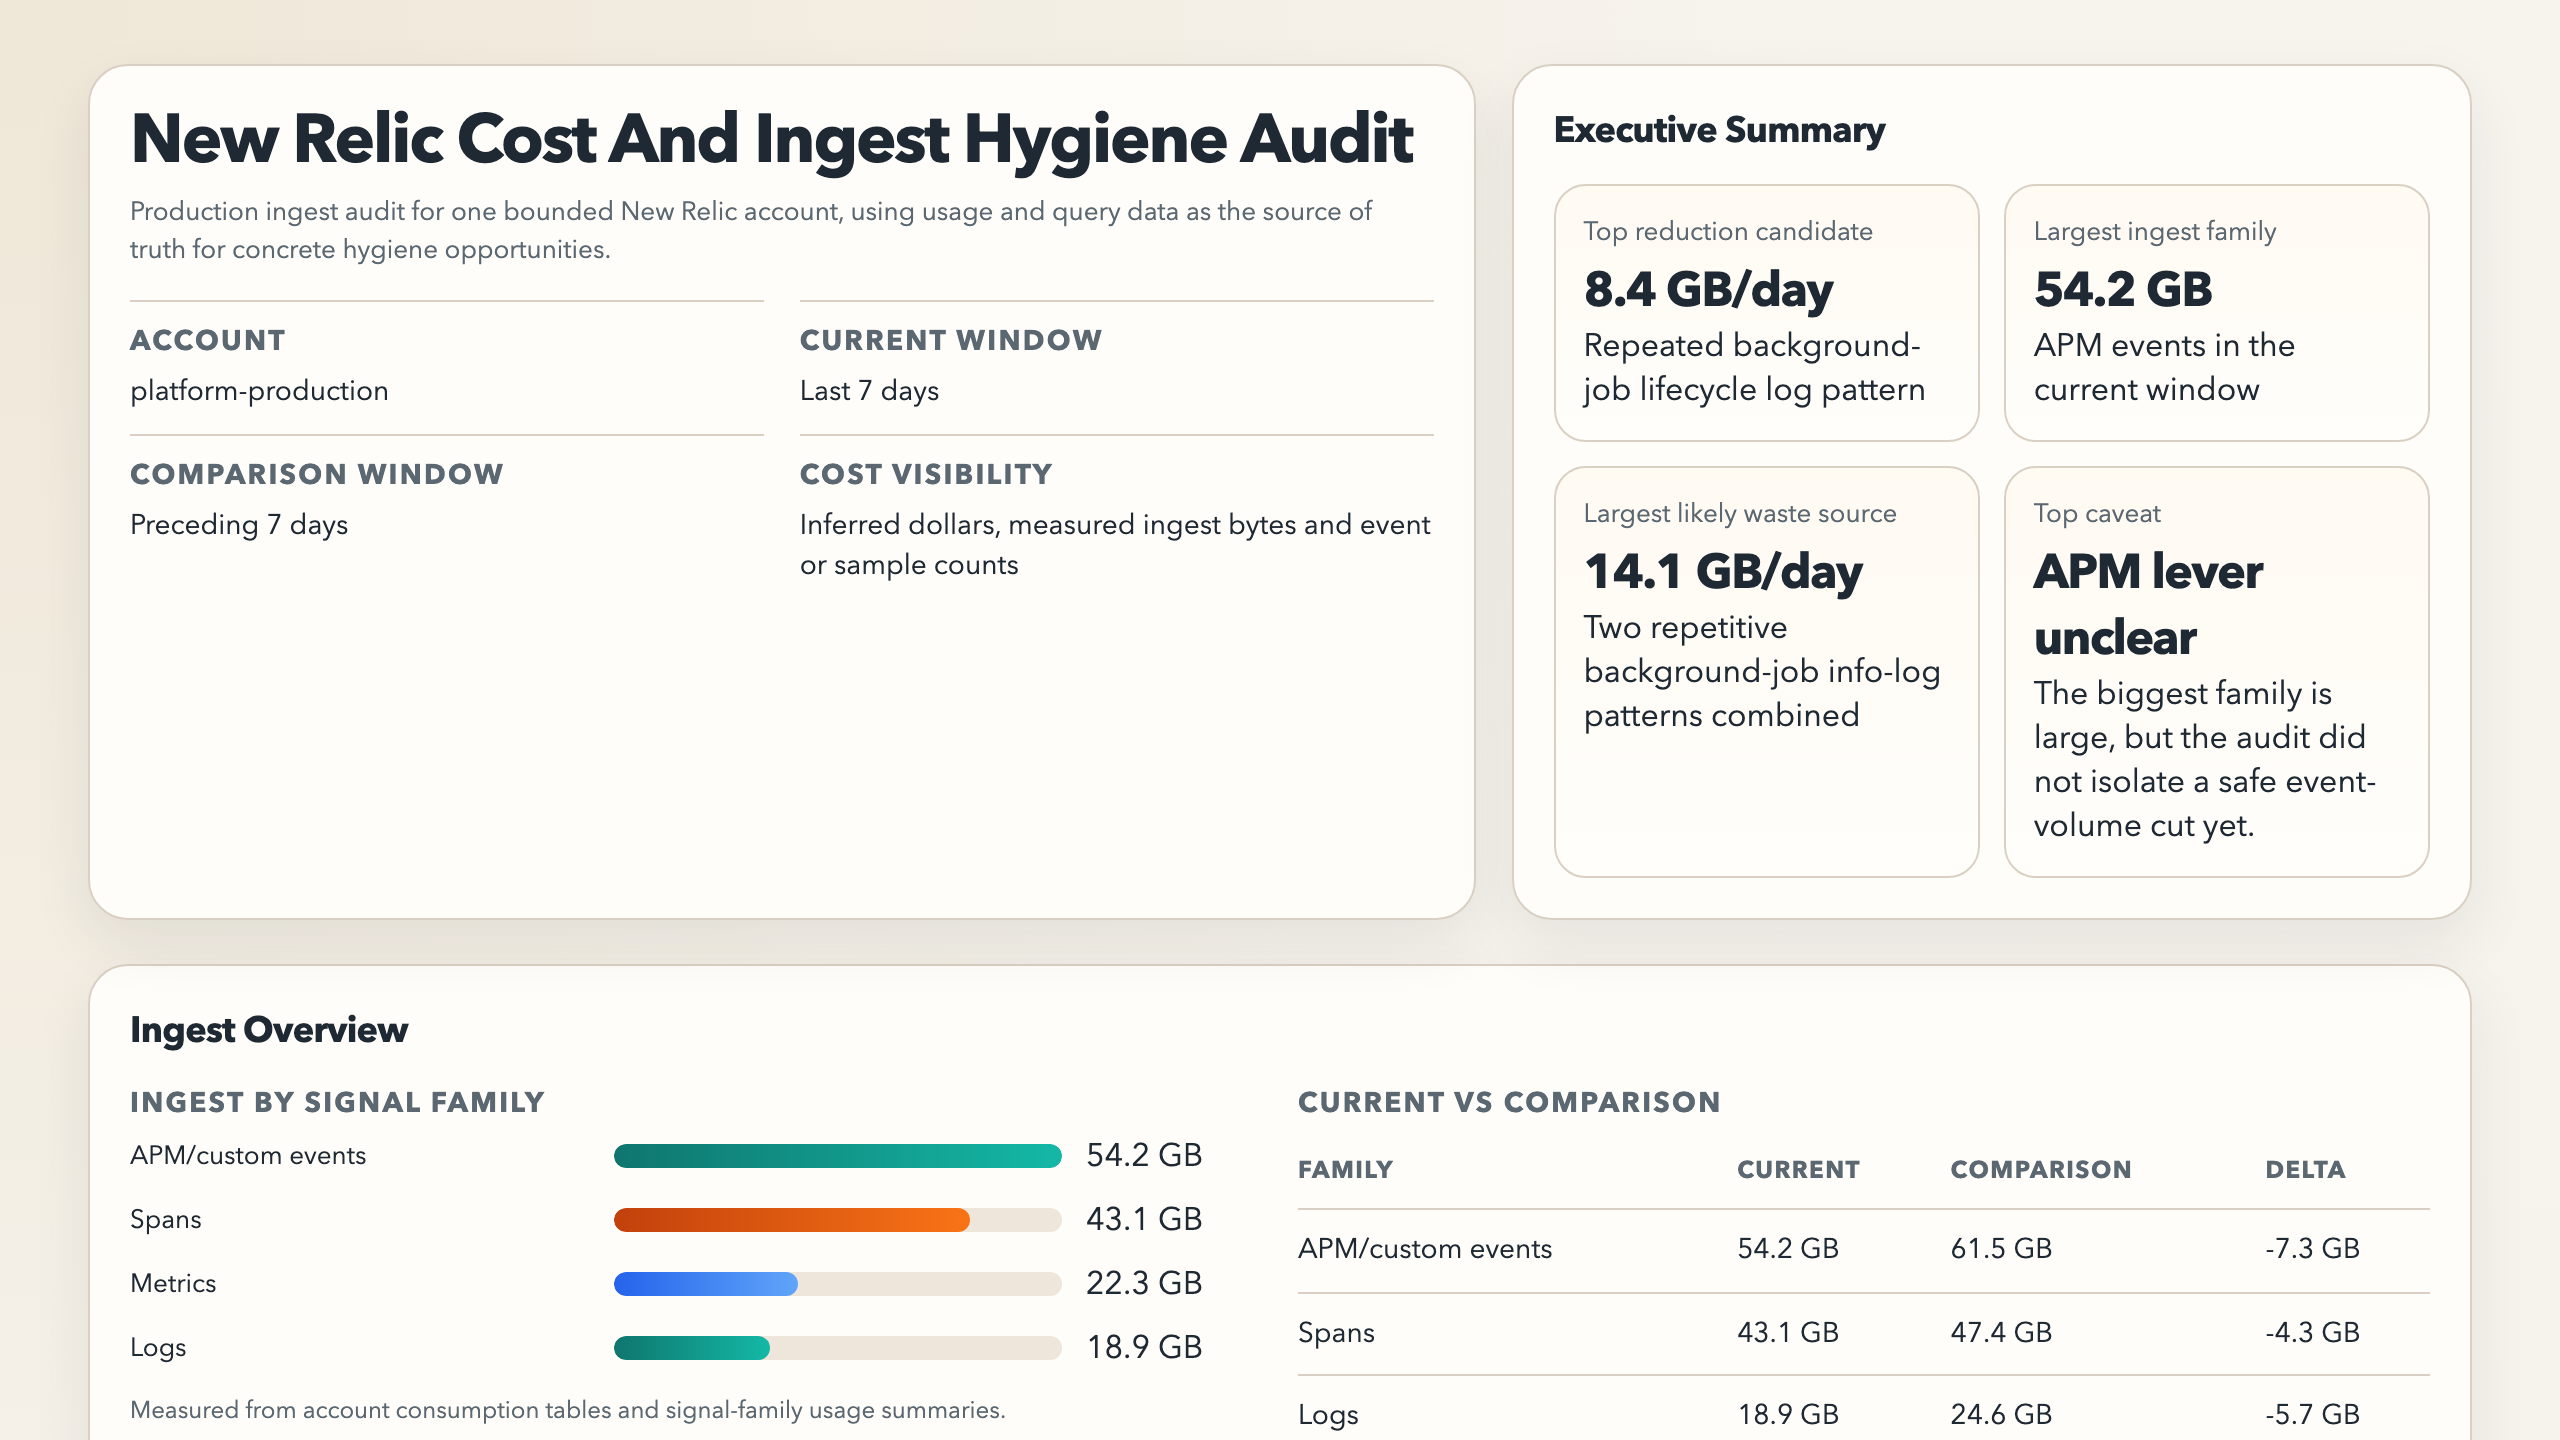
- Executive summary
- account, windows, cost visibility, top 3 reduction candidates, top estimated savings, and top caveat
- Ingest overview
- chart for ingest by signal family
- current vs comparison chart when comparison exists
- Top reduction candidates
- clear cards or rows for the best 3-5 candidates
- each should show surface, concrete waste pattern, smallest useful reduction, and likely savings
- Hotspot concentration
- chart for the top ingest surfaces or patterns by current volume
- Signal-family drilldowns
- logs: top repeated message templates, logger names, routes, or job labels when available
- spans: top repeated span names or categories when available
- metrics: top namespaces, integrations, or rollups when available
- APM/custom events only when they add clear value
- Large surfaces without a concrete lever yet
- Coverage gaps and caveats
For the HTML report:
- prefer simple inline SVG or lightweight HTML/CSS charts
- include estimated savings in GB or share when exact dollar cost is unavailable
- label findings as `actionable`, `needs deeper drilldown`, or `visibility gap`
- optimize for fast visual scanning, not exhaustive detail
Keep the Markdown audit compact. Use the HTML artifact for richer visual breakdowns.- Requires a completed run-configuration block with explicit account scope and time window.
- Reads the best available ingest and usage surfaces for the current and optional comparison windows.
- Ranks the biggest cost or noise hotspots across logs, spans, metrics, events, partitions, or integration errors.
- Returns one compact Markdown audit with a hotspot ledger, concrete reduction candidates, and the highest-value next actions.
- Produces an optional HTML report with charts and candidate cards for the most important surfaces.
- If it cannot identify a concrete lever inside a large surface, it should say that directly instead of pretending the surface itself is already actionable.
sequenceDiagram
    participant Agent
    participant NR as New Relic
    participant Report

    Agent->>NR: Read bounded usage and ingest evidence
    NR-->>Agent: Usage, consumption, and error signals
    Agent->>Report: Rank hotspots and write compact audit
Note over Agent: Read-only, no budget or pipeline changes- you want a recurring view of New Relic ingest pressure and telemetry waste
- you want to spot log, span, metric, or custom-event sources that are disproportionate or newly noisy
- you want one compact account-level audit instead of manually digging through usage screens
- you want likely reduction opportunities, not just ingest rankings
- New Relic access through MCP or the New Relic CLI
- Permission to read the account usage, ingest, and query surfaces you care about
Use a least-privilege New Relic account or API key. The public MCP server is a preview feature and should not be used for FedRAMP- or HIPAA-regulated accounts.
- Open Cursor Automations.
- Name your automation and paste new-relic-cost-and-ingest-hygiene-audit.md as the automation prompt.
- Add the New Relic MCP server.
- US accounts:
https://mcp.newrelic.com/mcp/ - EU accounts:
https://mcp.eu.newrelic.com/mcp/
- US accounts:
- Complete the OAuth flow or configure your environment for the official CLI alternative.
- Set the schedule or run manually, then save the automation.
- Click
Automation>New Automation. - Name your automation and paste new-relic-cost-and-ingest-hygiene-audit.md as the automation prompt.
- Install the New Relic MCP server or make the official New Relic CLI available in the runtime.
- Set the schedule or run manually and save the automation.
- Add the New Relic MCP server, or make the official New Relic CLI available in the runtime.
- Make sure the environment can read the account usage and query surfaces you expect.
- For repeated checks in an open Claude Code session, use
/loop, for example:
/loop 1w Follow the instructions in automations/new-relic-cost-and-ingest-hygiene-audit/new-relic-cost-and-ingest-hygiene-audit.md- For durable Claude-managed automation, use
/scheduleor create a Routine inclaude.ai/code/routines.
brew install newrelic-cli
newrelic profile add| Setting | Default |
|---|---|
| Account scope | required in run configuration |
| Current window | required in run configuration |
| Comparison window | optional in run configuration |
| First-pass hotspot cap | top 20 surfaces by ingest pressure |
| Final spotlight count | top 5 findings |
| Delivery | Markdown audit plus standalone HTML report artifact |
Keep the run conservative: prefer repeated high-volume, low-signal telemetry over one-day spikes, label cost pressure as inferred when exact cost is unavailable, and prefer specific patterns over service-level totals.
Add context only when the account scope or priorities are not obvious, for example:
Allowed New Relic account(s): platform-production
Environment: production
Current audit window: last 7 days
Comparison window: preceding 7 days
Priority signal families: logs, spans, custom events
Add policy only when needed, for example: prioritize logs and custom events over infrastructure metrics, and name repeated message templates or logger categories instead of stopping at service totals.