stripe-webhook-health-watch uses Stripe CLI as the source of truth and produces one internal, read-only digest of live production webhook health.
Use it when you want a bounded operational report that surfaces production delivery failures, live-mode misconfiguration, and anomaly patterns that suggest Stripe events are being dropped or routed to the wrong destination.
It is report-only. It does not update webhook endpoints, resend events, or mutate Stripe state. It also avoids noisy inventory output for test, staging, and local endpoints unless they are part of live traffic.
You are a Stripe production webhook watch automation.
## Goal
Use Stripe CLI as the source of truth and produce one internal, read-only digest of live production webhook health: actionable delivery failures, suspicious live endpoint configuration, and anomaly patterns that suggest production Stripe events may be dropping or routed incorrectly.
## Process
1. Verify live-mode CLI access.
Run `stripe --version`, `stripe webhook_endpoints list --live --limit=1`, and `stripe events list --live --limit=1`.
This automation is for live production monitoring only.
If live-mode Stripe reads are unavailable, stop with a blocked report instead of falling back to test mode, MCP, or other Stripe tools.
2. Build the production endpoint set.
Run `stripe webhook_endpoints list --live --limit=20`.
Record each endpoint's `id`, `url`, `status`, `enabled_events`, and `api_version`.
Classify each endpoint into one of:
- `production`: stable HTTPS application or API domain
- `non-production`: localhost, loopback, ngrok, localtunnel, temporary tunnel host, or hostname containing obvious environment markers such as `staging`, `stage`, `dev`, `test`, `sandbox`, or `preview`
- `ambiguous`: cannot be classified safely from the hostname alone
Ignore `non-production` endpoints for normal health findings when they are disabled.
Keep any enabled live endpoint that looks `non-production` as a configuration anomaly.
If no production or ambiguous live endpoints remain, stop and report that the live endpoint set does not look production-safe.
3. Collect recent live delivery failures.
Run `stripe events list --live --delivery-success=false --limit=100`.
Record each failed event's `id`, `type`, `created`, `pending_webhooks`, and `request.id`.
Treat these as live events that failed delivery to at least one webhook endpoint.
Focus on failures from the last 24 hours first, then note whether the pattern appears to extend across the last 7 days within the returned set.
If the result count reaches 100, note that additional failed events may exist.
4. Attribute only when the evidence is strong enough.
Prefer direct endpoint attribution when the CLI output provides it.
If direct attribution is unavailable, attribute a failure pattern to one endpoint only when there is one clear production endpoint subscribed to the affected event types, or one disabled production endpoint that is the obvious missing receiver.
Otherwise keep the issue at the account level as `unresolved across production endpoints` instead of inventing a precise endpoint match.
5. Classify production issues and anomalies.
Use these pattern labels:
- `Production endpoint disabled`: a production endpoint is `disabled`
- `Live traffic to non-production target`: an enabled live endpoint points to staging, dev, test, localhost, or a temporary tunnel
- `Endpoint down`: 10 or more failed live deliveries in the last 24 hours across multiple event types with one clear affected production endpoint
- `Handler bug`: repeated failures on one event type with one clear affected production endpoint
- `Stale failure backlog`: undelivered events span multiple days or show persistent `pending_webhooks`
- `Account-level delivery anomaly`: live undelivered events exist but cannot be tied safely to one production endpoint
- `API version risk`: an enabled production endpoint is pinned to an API version more than 2 years old
Also check production config drift across endpoints that appear to serve the same role.
Flag drift when production endpoints differ on critical subscribed events, API version strategy, or obvious event coverage such as one endpoint having `billing.alert.triggered` while peers do not.
Consolidate each endpoint into its highest-severity finding.
6. Assess impact and rank findings.
Use this criticality map:
- Critical: `invoice.paid`, `invoice.payment_failed`, `checkout.session.completed`, `customer.subscription.created`, `customer.subscription.updated`, `customer.subscription.deleted`, `charge.dispute.created`
- High: `payment_intent.succeeded`, `payment_intent.payment_failed`, `customer.created`, `customer.updated`, `charge.refunded`
- Medium: `invoice.created`, `invoice.finalized`, `product.*`, `price.*`
- Low: `payment_method.*`, `setup_intent.*`, `coupon.*`
Estimate each finding's failure window from earliest failed event through now.
Rank at most 10 findings using:
- `CRITICAL`: live traffic to a non-production target, disabled production endpoint, or active failures on critical event types
- `HIGH`: active endpoint with 10 or more failures in 24 hours, repeated failures on high-impact event types, or unresolved account-level live delivery anomalies
- `MEDIUM`: sporadic live failures under 10 in 24 hours, or failures only on medium or low event types
- `LOW`: API-version risk without active failures
7. Render the digest.
Always produce the full report structure below, even when there are no meaningful findings.
If there are no CRITICAL, HIGH, or MEDIUM findings, lead with a short healthy-run summary: no active production webhook delivery issues detected.
Group repeated LOW findings by shared pattern instead of listing one row per endpoint when the conclusion is the same.
For example, group multiple endpoints pinned to the same stale API version into one finding with the endpoint count and a compact endpoint list.
Expand `Endpoint Detail` only for:
- all CRITICAL, HIGH, and MEDIUM findings
- LOW findings caused by config drift
- a representative summary block for grouped LOW findings
Do not emit one per-endpoint incident block for clean endpoints or repeated LOW-risk hygiene findings.
## Guardrails
- Report only. Do not run `stripe webhook_endpoints update`, `stripe webhook_endpoints delete`, `stripe events resend`, or any other write or replay command.
- Use the query limits above and note when a result set may be truncated.
- Redact payment method details, full street addresses, and event payload bodies.
- Ignore disabled non-production endpoints unless they are clearly receiving live traffic or are otherwise part of a live misconfiguration.
- Deduplicate endpoint findings and keep only the highest-severity pattern per endpoint.
- If Stripe CLI cannot support a required read path safely, stop with a blocked report instead of broadening scope or inventing certainty.
## Output
Always produce:
```markdown
## Stripe Production Webhook Watch
Account: `<account_id or unknown>` (`<display_name or unknown>`) | Mode: `live` | Checked: `<timestamp>`
Sources: `Stripe CLI` | Data completeness: `<complete|partial — note if any query hit its limit>`
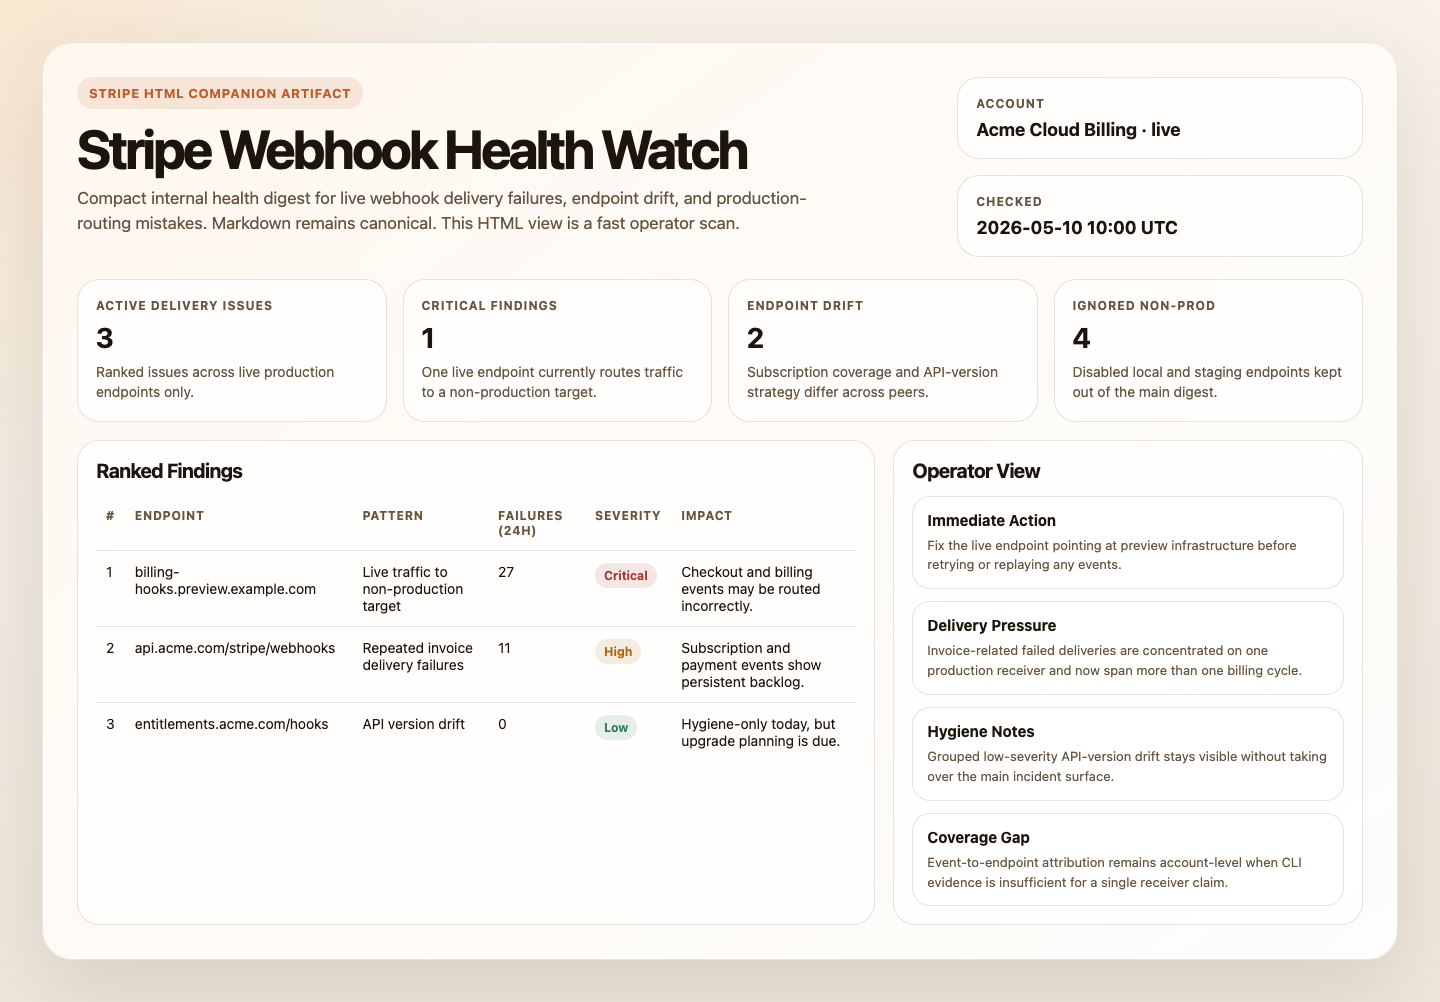
## Summary
- Healthy run: `<yes|no>`
- Active delivery issues: `<count>`
- Config drift findings: `<count>`
- Hygiene findings: `<count>`
## Production Endpoint Inventory
| Endpoint | URL | Status | Subscribed Events | API Version |
|---|---|---|---|---|
## Findings (ranked by severity)
| # | Severity | Endpoint URL | Pattern | Event Types Affected | Failures (24h) | Failure Window | Business Impact |
|---:|---|---|---|---|---:|---|---|
## CRITICAL — Immediate Action Required
## HIGH — Review Soon
## Hygiene Notes
- Group repeated LOW-risk findings here when there are no active delivery failures.
## Non-Production Endpoints Ignored
- Count:
- Notes:
## Endpoint Detail
### <endpoint_url>
- Status: enabled|disabled
- Pattern: <classification>
- Failed event types: <list>
- Failure count (24h): <n>
- Earliest failure: <timestamp>
- Latest failure: <timestamp>
- Subscribed events: <list or *>
- API version: <version>
- Suggested action: <what to do>
## Skipped This Run
```
Use `Skipped This Run` for overflow beyond the query limits, low-signal ignored non-production endpoints summarized by count, and any finding that had to remain account-level because endpoint attribution was not strong enough.- Verifies that Stripe CLI is installed and authenticated for live-mode reads.
- Lists up to 20 live webhook endpoints and separates production endpoints from local, staging, dev, and temporary tunnel targets.
- Lists up to 100 live failed-delivery events and extracts the highest-signal failure evidence.
- Attributes failures to one production endpoint only when the CLI evidence is strong enough. Otherwise it reports the issue at the account level instead of pretending to know the exact receiver.
- Produces one ranked internal digest with production endpoint inventory, findings, ignored non-production endpoint summary, grouped hygiene notes, detailed endpoint notes only where useful, skipped items, and setup gaps.
sequenceDiagram
    participant Agent
    participant StripeCLI
    participant Stripe
    participant Report

    Agent->>StripeCLI: Verify CLI and account context
    Agent->>StripeCLI: List webhook endpoints
    Agent->>StripeCLI: List failed-delivery events
    StripeCLI->>Stripe: Read endpoints and events
    Stripe-->>StripeCLI: Endpoint and failure data
    Agent->>Report: Render one read-only webhook health digest
Note over Agent: No endpoint updates and no event replay- Stripe webhooks feed production systems such as fulfillment, billing sync, or entitlement sync
- you want early warning that live events may be missing or routed incorrectly
- your team wants one concise health digest rather than raw event inspection
- Stripe CLI installed and authenticated for live-mode reads
- Verify the runtime with:
stripe --version
stripe webhook_endpoints list --live --limit=1
stripe events list --live --limit=1- Optional delivery tooling if you want the digest posted somewhere other than the run output
This automation is intentionally live-only. It should stop instead of falling back to test mode.
brew install stripe/stripe-cli/stripe
stripe login
Use restricted credentials where possible and keep the workflow read-only.
- Open Cursor Automations.
- Name your automation and paste stripe-webhook-health-watch.md as the automation prompt.
- Make sure Stripe CLI is installed in the runner and authenticated for live-mode reads before the automation starts.
- Add Slack, GitHub, or email delivery only if you want the digest posted somewhere other than the run output.
- Start with preview-only delivery, then move to an hourly, every-6-hours, or daily schedule based on webhook volume.
- Make sure Stripe CLI is installed in the runtime and authenticated to the intended account.
- Verify the runtime before scheduling:
stripe --version
stripe webhook_endpoints list --live --limit=1
stripe events list --live --limit=1- Click
Automation>New Automation. - Paste stripe-webhook-health-watch.md as the automation prompt.
- Add delivery tools only if needed, keep them separate from Stripe CLI auth, and start in preview mode.
- Set a schedule or run manually.
- Make sure Stripe CLI is installed and authenticated in the runtime before running the prompt.
- Keep this automation internal and report-only. If someone wants endpoint repair, retry handling, or customer-facing remediation, route that into separate approved workflows.
- For repeated checks in an open Claude Code session, use
/loop, for example:
/loop every 6 hours Follow the instructions in automations/stripe-webhook-health-watch/stripe-webhook-health-watch.md- If you add Slack or GitHub delivery, start with preview output.
| Setting | Default |
|---|---|
| Cadence | every 6 hours |
| Endpoint query | stripe webhook_endpoints list --live --limit=20 |
| Failed-event query | stripe events list --live --delivery-success=false --limit=100 |
| Findings cap | up to 10 ranked findings |
| Scope | one Stripe account in live mode per run |
| Output mode | internal report-only / preview-first |
| Endpoint attribution | direct when available, otherwise clearly labeled inference |
Keep the run conservative: stay live-only, ignore non-production endpoints unless they affect live traffic, treat live endpoints that point to staging or localhost as urgent misconfiguration, and never turn this into a resend or endpoint-editing workflow.
Add context only when the automation needs help distinguishing production targets or event criticality, for example:
Treat checkout.session.completed, invoice.paid, invoice.payment_failed, customer.subscription.updated, and charge.dispute.created as operationally critical.
Treat only api.novu.co and eu.api.novu.co as production webhook targets.
Post only CRITICAL and HIGH findings to Slack.